U.S. County Map – Poverty Rate of the Population Under 18 (2021)
| Weight | 8 oz |
|---|---|
| Dimensions | 26 × 2 × 2 in |
| Size (inches) | |
| Finishing Options |
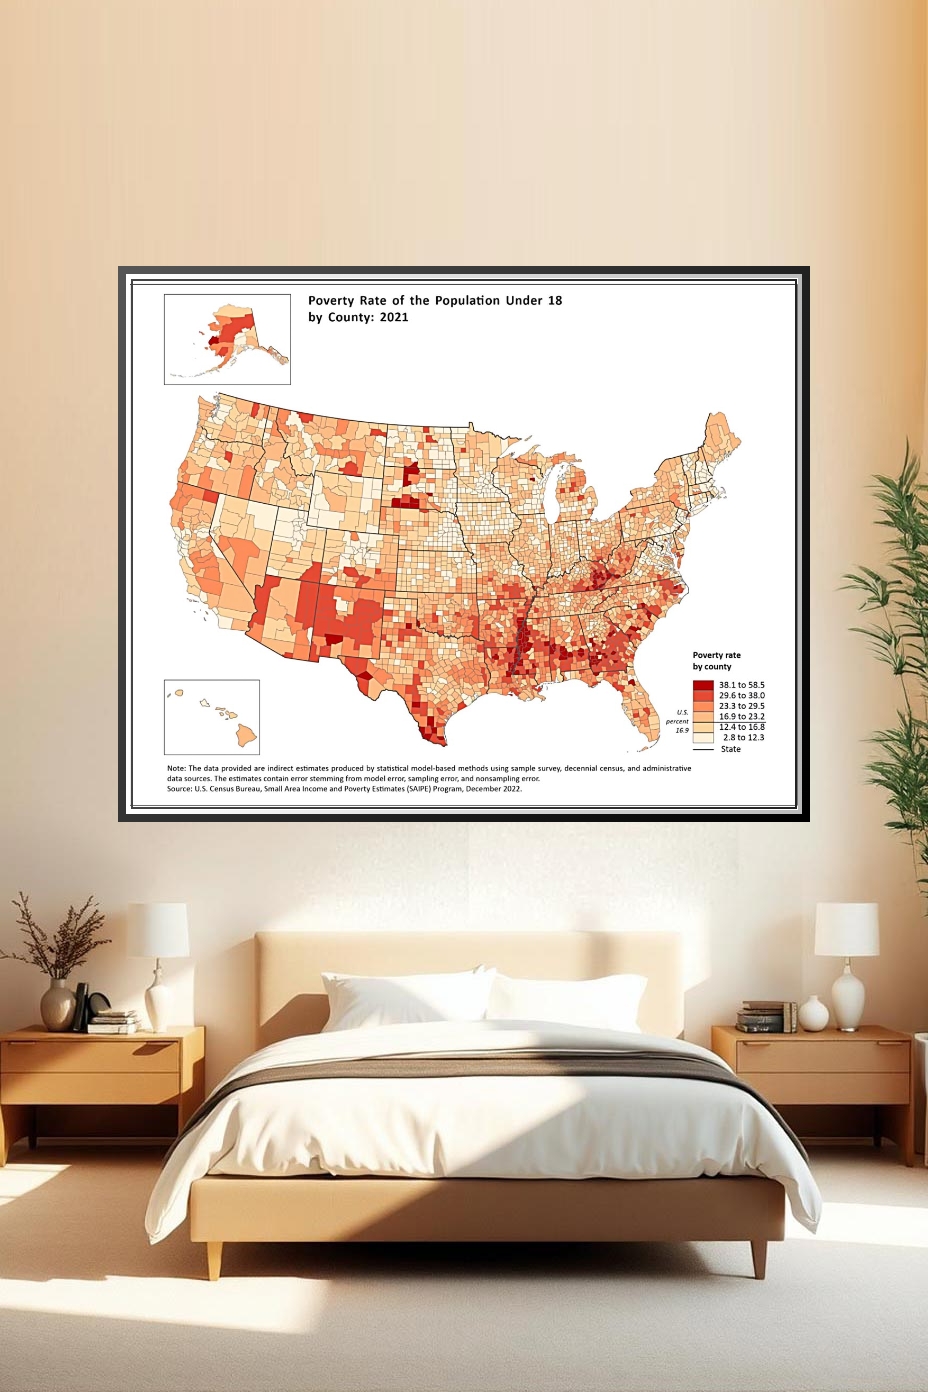
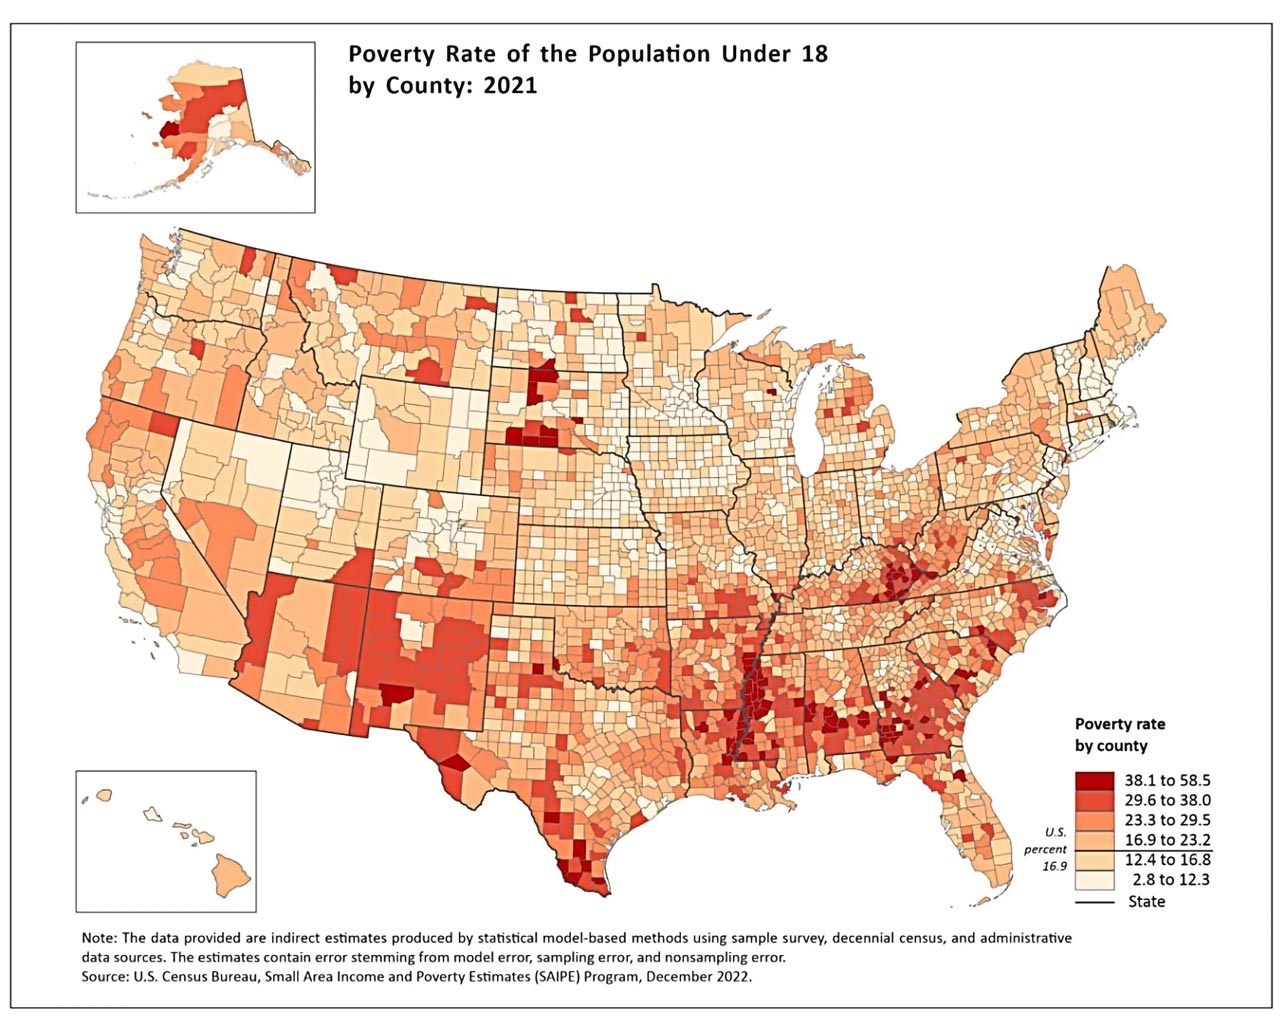
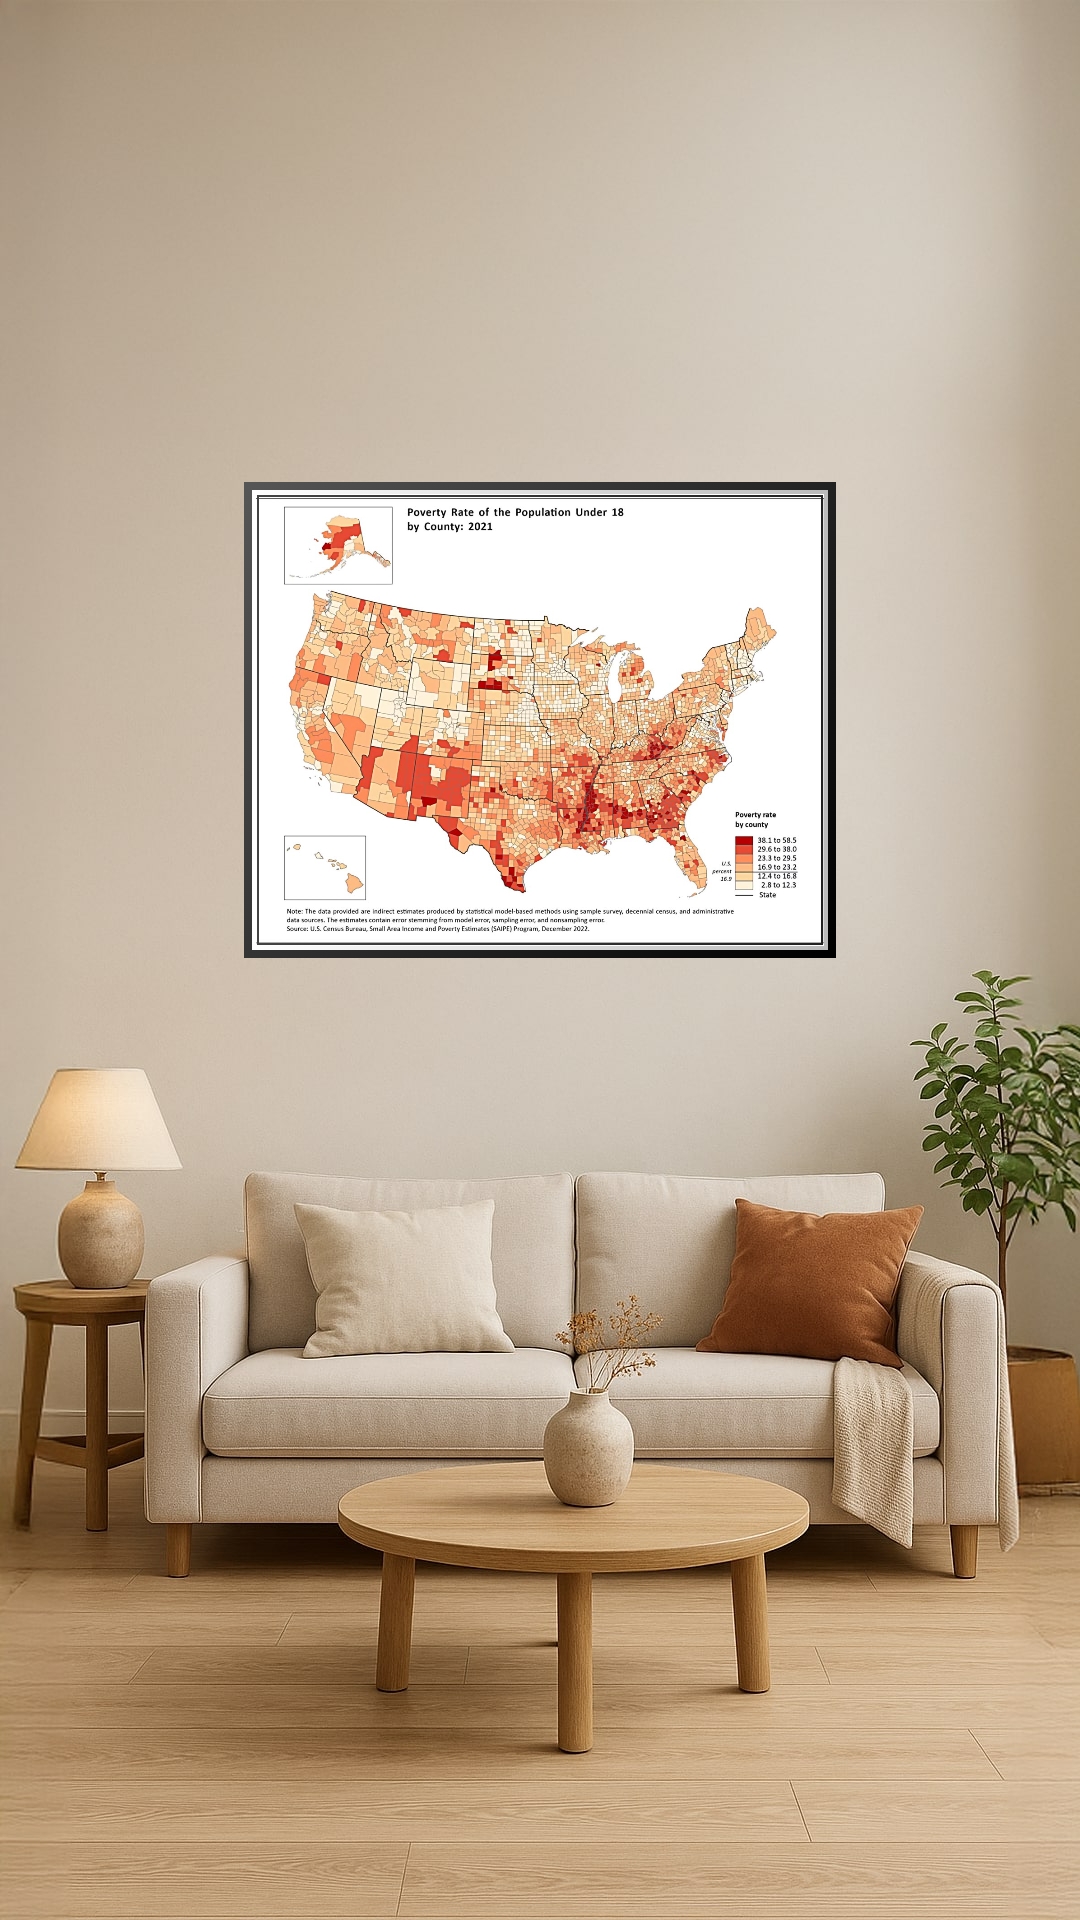
U.S. County Map – Poverty Rate of the Population Under 18 (2021)
This detailed U.S. county map illustrates the poverty rate among the population under 18 years of age in 2021. Using a gradient color scale, it highlights regions with varying poverty rates, from lower levels in lighter shades to higher concentrations in deep red. The map provides a visual breakdown by county, offering valuable insights into regional disparities across the United States. Ideal for educators, researchers, students, and policy analysts, this map serves as a compelling visual aid for understanding socioeconomic conditions affecting American youth.
How to Choose the Right Finish for Your Map
similar maps


Reviews
There are no reviews yet.